Figure 8.
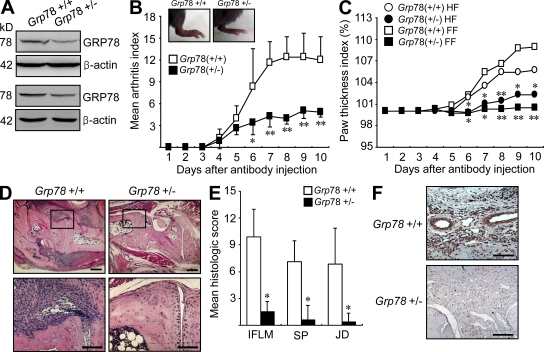
Arthritis induction in Grp78+/+ and Grp78+/− mice. (A) Western blot analysis of GRP78 in the joint tissues. Lysates obtained from the joints of Grp78+/− (n = 2) and wild-type littermates (Grp78+/+; n = 2) were subjected to Western blot analysis using anti-GRP78 and anti–β-actin antibodies. (B) The severity of anti–type II collagen antibody–induced arthritis in Grp78+/− (n = 7) and wild-type littermates (Grp78+/+; n = 7). Values are mean and SD. *, P < 0.05; **, P < 0.005 versus Grp78+/+ mice. (C) Effect of Grp78 deficiency on paw edema in mice with antibody-induced arthritis, as determined by the paw thickness index calculated at the indicated time points. Results are paw thickness index of forefoot (FF) and hind foot (HF). Values are mean. *, P < 0.05; **, P < 0.005 versus Grp78+/+ mice. (D) Hematoxylin and eosin staining of ankle joint sections obtained from Grp78+/− and Grp78+/+ mice 10 d after arthritis induction. The rectangular areas in the top images are magnified in the bottom images. (E) Mean histological scores of inflammatory cell infiltration (IFLM), synovial proliferation (SP), and joint destruction (JD) in Grp78+/− (n = 4) versus Grp78+/+ mice (n = 4) as determined on day 10 after antibody administration. Values are the mean and SD of four mice per group. *, P < 0.001 versus Grp78+/+ mice. (F) Immunohistochemical staining for vWF. Positive cells are shown in brown. Representative photographs are shown. Bars: (D, top) 300 µm; (D, bottom) 120 µm; (F) 60 µm.

