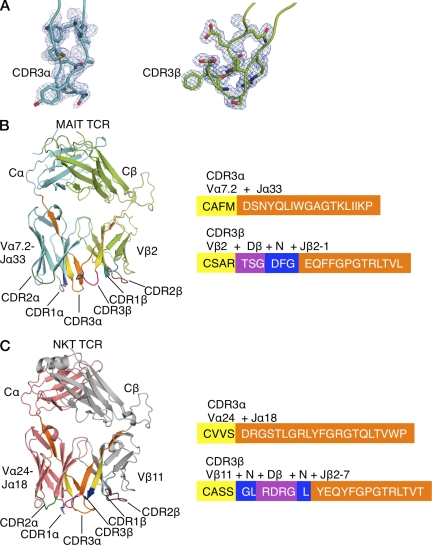
Figure 1.
Structures of MAIT and NKT TCRs. (A) 2Fo-Fc electron density map shown as a blue mesh and contoured at 1 sigma for the CDR3α and CDR3β of the MAIT TCR. (B) Structure of MAIT TCR and amino acid composition of CDR3 loops. TCRα chain, cyan; TCRβ chain, light green; CDR1α, purple; CDR2α, dark green; CDR1β, teal, CDR2β, ruby; CDR3 loops, color coded according to their genetic origin (right). (C) Structure of NKT TCR and amino acid composition of CDR3 loops. TCRα chain, salmon; TCRβ chain, gray; CDR loops, color coded as in B.

