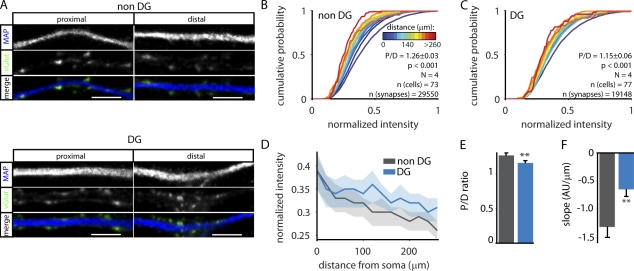
Figure 6.
Strongly reduced distance-dependent scaling in DG cells. (A) Example images of proximal and distal synapses in DG and non-DG cells. Bars, 5 µm. (B) Cumulative histograms of normalized vGlut intensity of non-DG cells. vGlut intensity was normalized to the largest synapse per cell. P/D is the ratio of proximal (<50 µm) over distal (last 50 µm), and p-value is the significance of the P/D ratio. N represents the number of independent experiments. (C) As in B, for DG cells. (D) Comparison of the histograms in B and C. Solid line represents the median, and the shaded area shows the 0.4–0.6 boundaries. (E) P/D ratio of vGlut intensity of DG and non-DG cells. (F) Mean slopes of linear line fits through data from individual neurons. Error bars represent means ± SEM. **, P < 0.01. AU, arbitrary unit.

