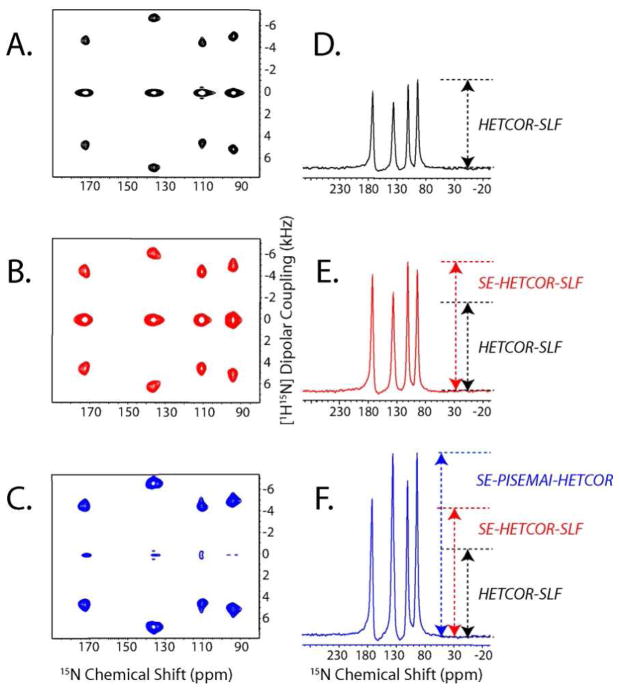
Figure 6.
1D and 2D projections of the 3D spectra of 15N NAL single crystal. F1 and F2 dimensions are scaled to compensate for the scaling factors (sFSLG, sFSLG-CP, and sWIM24). The 2D spectra in (A), (B), and (C) are obtained by summing the 1H chemical shift planes (between 2 and 20 ppm) of the 3D HETCOR-SLF, SE-HETCOR-SLF, and SE-PISEMAI-HETCOR spectra, respectively. The 1D spectra in (D), (E) and (F) are obtained by summing the dipolar cross sections (3 and 7.5 kHz) of panels (A), (B) and (C), respectively. A total of 8 scans were used for 32 t1 and t2 increments. During the τ period (120 μs), a WIM24 pulse train is applied using 5 μs 90° pulses. Note that the zero frequency peaks in (A) and (B) are of opposite sign with respect to the dipolar peaks.

