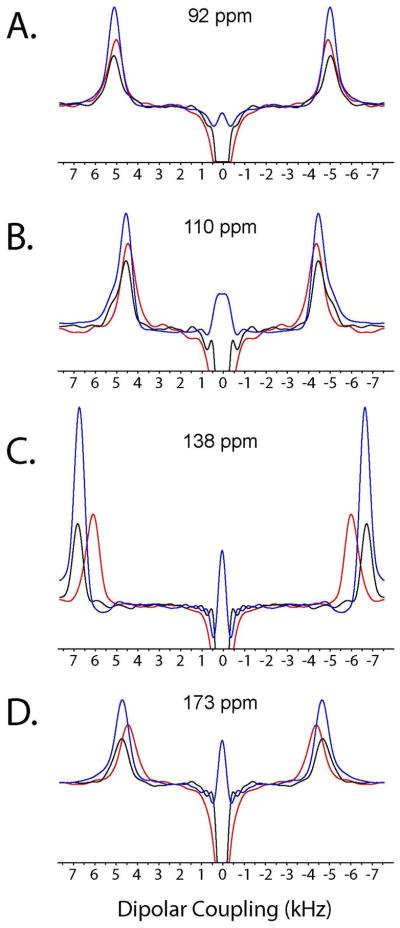
Figure 7.
The spectra in panels A–D are the dipolar cross-sections of the spectra reported in Figure 6. The traces from the HETCOR-SLF, SE-HETCOR-SLF and SE-PISEMAI-HETCOR spectra are colored in black, red, and blue, respectively. For the HETCOR-SLF and SE-PISEMAI-HETCOR spectra, the dipolar line widths (A–D) are 800 Hz, 565 Hz, 715 Hz, and 685 Hz, respectively. For SE-HETCOR-SLF, the dipolar line widths (A–D) are 890 Hz, 744 Hz, 774 Hz and 800 Hz, respectively.

