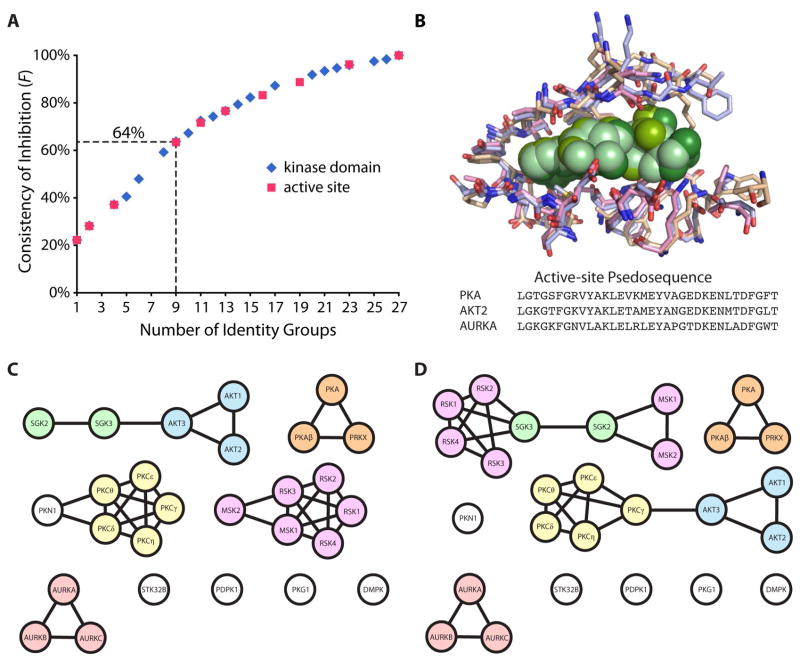
Figure 7.
Comparison of inhibition frequencies between kinase domain or active site identity groups. (A) Average F values for incrementally binned identity groups were plotted for either the full kinase domain or active site residues. (B) The crystal structures and pseudosequence of residues within 6 Å of an ATP analog (green) aligned for PKA, AKT2, and AURKA. Homology maps generated using a percent identity cutoff that results in the formation of nine groups for the (C) kinase domain and (D) active site residues.

