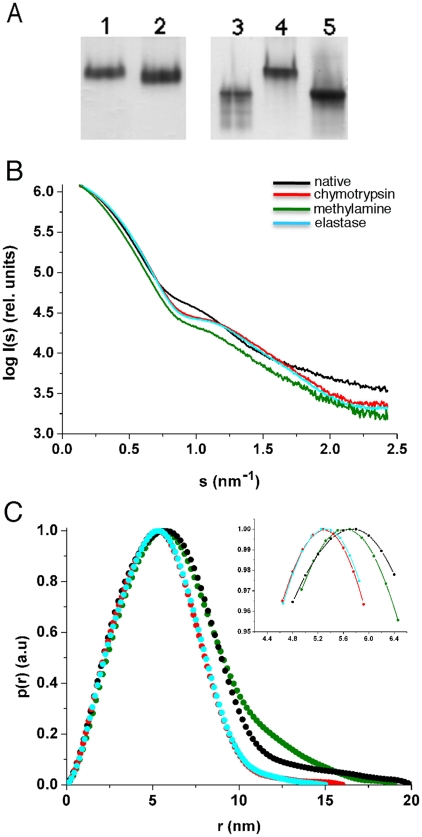
Figure 3. ECAM shows a change in gel mobility and overall structure upon activation.
(A) Native PAGE showing the migration profile of ECAM. Lanes 1) native molecule; 2) methylamine-treated; 3) after reaction with chymotrypsin; 4) native molecule; 5) after reaction with porcine pancreatic elastase (B) Small-angle X-ray scattering (SAXS) results for native, methylamine-activated, elastase- and chymotrypsin-reacted ECAM. The radially averaged scattered X-ray intensity was plotted as a function of the momentum transfer s. Scattering patterns for ECAM in native form (black), after reaction with methylamine (green), elastase (blue) and chymotrypsin (red) were recorded in different concentrations (from 0.5 to 8 mg/mL) but only the curves relating to the highest concentration are shown. Inset, detail of differences in distinct side maxima. (C) Distance distributions p(r) of native, methylamine-reacted, elastase, and chymotrypsin of ECAM. All curves were normalized. Inset, detail of maxima of p(r) functions.

