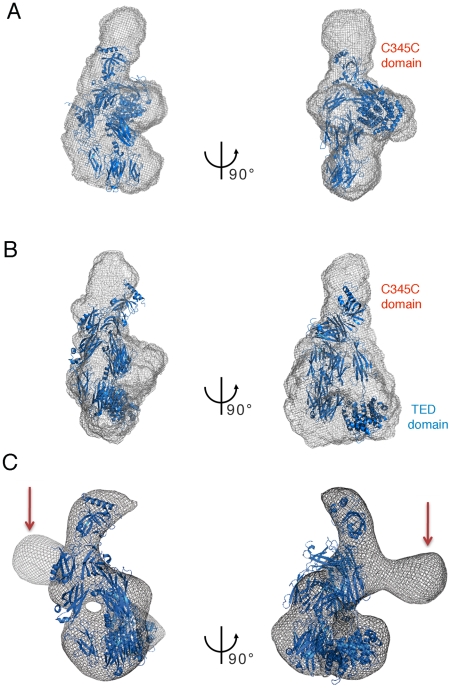
Figure 5. The structures of both native and activated forms of ECAM resemble those of C3 and C3b.
Surface representations of ECAM in native (A) and methylamine-activated (B) states based on SAXS measurements. Structures of C3 (PDB 2A73) and C3b (PDB 2I07, in blue) were modeled manually into the ECAM ab initio SAXS models. Note that the difference in position of the C3/C3b TED (thioester-containing) domain can be well accounted for in the SAXS envelopes of both native (A) and methylamine-activated (B) forms of ECAM. (C) The X-ray structure of C3b (PDB 2I07) was manually fitted into the 3D EM envelope of the activated ECAM. The size of the macromolecule as well as the MG ring and the TED domain are in comparable positions. The unoccupied density, shown with red arrows, indicates the different potential position of the C-terminus domain and indicates high flexibility in this region. The lack of sequence similarity between the C-terminal domain of ECAM and C3b (Fig. S6) could also account for the differences observed.

