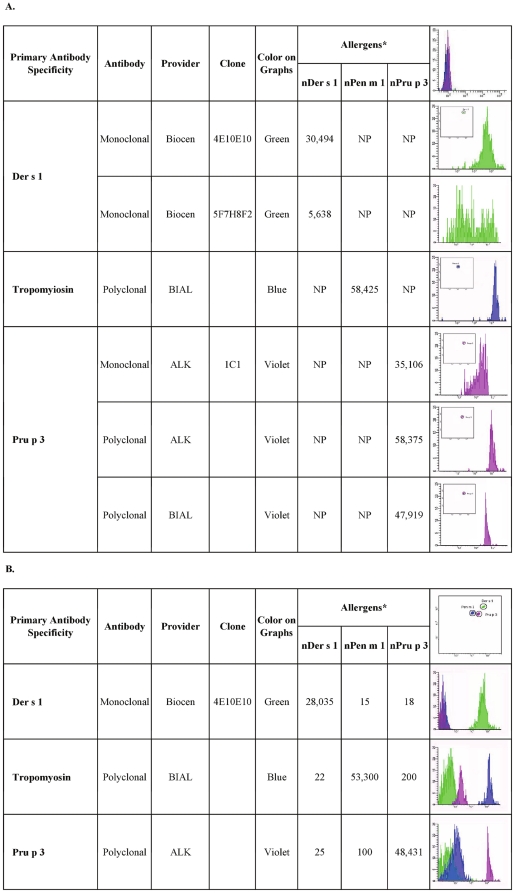
Figure 1. Detection of allergen conjugation on micro-beads using mouse monoclonal and rabbit polyclonal antibodies.
Panel A: Each antibody preparation was tested on the respective allergen-coupled micro-bead. The other two micro-beads were not in the tube. NP: Not performed in this singlepex testing. * Values are expressed as Median Fluorescence Intensity [MFI]. Upper right corner: an example of blank fluorescence reading of the three conjugated micro-beads without serum. Panel B: Antibodies selected on the basis of the findings reported in panel A were tested on the three allergen-coupled micro-beads, all found in the same testing tube. * Values are expressed as Median Fluorescence Intensity [MFI]. Upper right corner: an example of micro-bead fluorescence scatter plot and micro-bead clusters.

