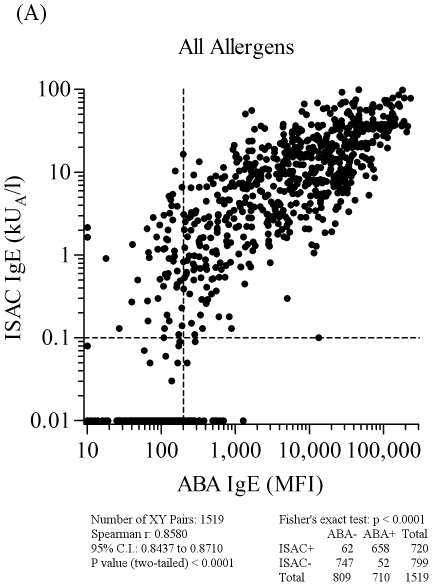
Figure 5. ABA versus ISAC IgE correlation results on 1,519 serum samples selected on the basis of any of the allergen specificities reported in Table S1, using the two micro systems.
Letter flag (A) in figure 5 indicates it as part of the results shown also in figures 6, 7, and 8. Consecutive letters are used on purpose to recall result type continuity across the four figures. Allergen nature, being either natural or recombinant, matched for both tests. Vertical dashed lines represent the arbitrary ABA negative cut off value. Horizontal dashed lines mark the value range where ISAC IgE determinations are not always reproducible (unpublished data). For graphical visualization needs on log scales, zero values for ABA were set at 10 MFI on the X axis, and at 0.01 kU/l for ISAC values on the Y axis. The Spearman r correlation coefficient was calculated and the χ2 test was used for statistical purposes. Statistical results are reported below the graph.

