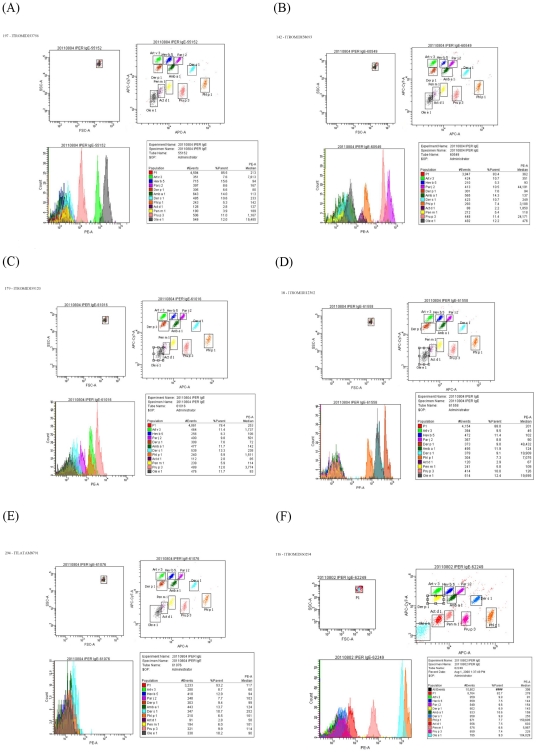
Figure 9. Selected examples of Allergen micro-Beads Array (ABA) IgE testing report.
Eleven different micro-beads were tested in the same tube in each run for each sample. Examples were selected on purpose among the samples with high total IgE. All IgE positive and negative ABA results matched the ISAC results. Numbers in the upper left corner indicate the Table S1 row numbers and patients' ID. In each panel: the upper left graph shows clustered micro-beads by their dimension; the upper right: scatter plots of each fluorescent bead; the lower left: fluorescence intensity and event counts; the lower right: summary table with median fluorescence values. Samples reported in each of the six panels had the following total IgE values: Panel A = 9,730 IU/l; Panel B = 1,351 IU/l; Panel C = 1,220 IU/l; Panel D = 1,931 IU/l; Panel E = 20,900 IU/l; Panel F = 23,540 IU/l.

