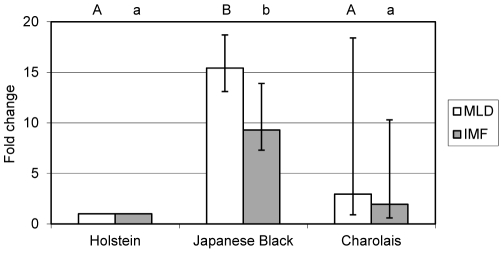
Figure 1. ASIP mRNA abundance in M. longissimus (MLD) and dissected intramuscular fat (IMF).
Bars represent means of fold changes compared to Holstein (n = 5) with 95% confidence interval, marked by vertical lines. Different letters indicate significant differences to Holstein within tissue (p<0.05). Number of samples: Japanese Black (n = 6 [MLD], n = 5 [IMF]), Charolais (n = 6).

