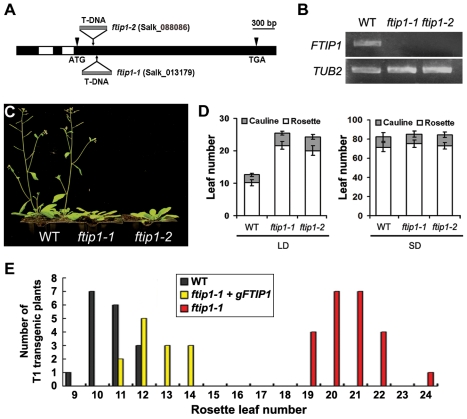
Figure 1. FTIP1 promotes flowering under LDs.
(A) Schematic diagram showing the FTIP1 coding region and T-DNA insertion mutants. Exons and introns are indicated by black and white boxes, respectively. Two T-DNA insertion lines, ftip1-1 and ftip1-2, were obtained from Arabidopsis Biological Resource Center. (B) FTIP1 expression is undetectable in ftip1-1 or ftip1-2 by semi-quantitative PCR using the primers flanking T-DNA insertion sites (Table S2). (C) ftip1-1 and ftip1-2 show later flowering than wild-type plants at 35 d after germination under LDs. (D) Flowering time of ftip1-1 and ftip1-2 grown under LDs and SDs. Error bars indicate SD. (E) Distribution of flowering time in T1 transgenic plants carrying the FTIP1 genomic fragment (Figure S2A) in ftip1-1 background.

