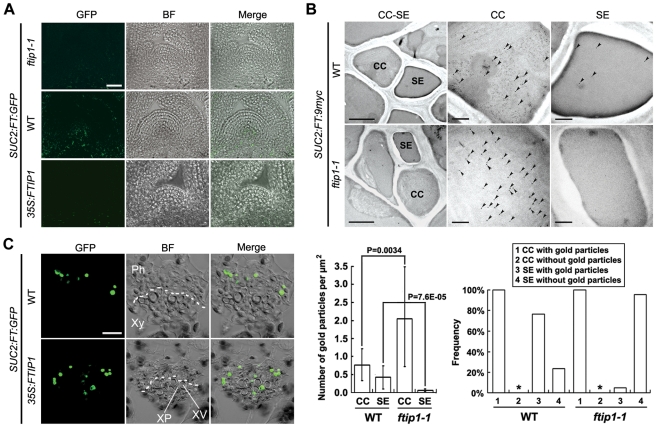
Figure 5. FTIP1 is required for FT protein transport.
(A) Confocal analysis of FT:GFP protein distribution in the apical region of 11-d-old SUC2:FT:GFP seedlings in different genetic backgrounds. Bar, 20 µm. (B) Analysis of FT:9myc distribution in CC-SE complexes in the first rosette leaves of 15-d-old SUC2:FT:9myc and SUC2:FT:9myc ftip1-1 seedlings by immunogold electron microscopy using anti-myc antibody. The upper left panels show the representative CC-SE complexes, while higher magnification views of CCs or SEs are shown in the upper middle or right panels, respectively. Arrowheads indicate the locations of gold particles. The lower left panel shows the quantification of FT:9myc immunogold signals in CCs and SEs of SUC2:FT:9myc (WT background) or SUC2:FT:9myc ftip1-1 (ftip1-1 background). The data are presented as the mean number of gold particles per µm2 plus or minus standard deviation. Statistical analysis was performed using a two-tailed unpaired Student's t test. The results are considered statistically significant at p<0.05. The lower right panel shows the frequency histogram of appearance of FT:9myc immunogold signals in CCs and SEs in all examined sections of SUC2:FT:9myc or SUC2:FT:9myc ftip1-1. Asterisks indicate that in all sections examined, the frequency we observed CCs without gold particles is zero. Bars: upper left panels, 2 µm; upper middle and right panels, 0.5 µm. (C) Confocal analysis of FT:GFP protein distribution in the primary vein of the first rosette leaves from 11-d-old SUC2:FT:GFP seedlings in different genetic backgrounds. The dotted lines indicate the approximate boarder between xylem and phloem. GFP, GFP fluorescence; BF, bright field image; Merge, merge of GFP and BF; CC, companion cell; SE, sieve element; Ph, phloem; Xy, xylem; XP, xylem parenchyma; XV, xylem vessel. Bar, 20 µm.

