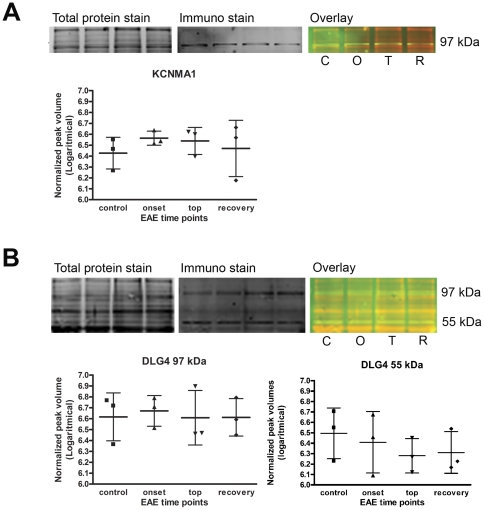
Figure 9. Western blot analysis of DLG4 and KCNMA1.
A quantitative fluorescent western blot was performed to analyze the presence and expression levels of KCNMA1 (Panel A) and DLG4 (Panel B). By means of peak detection, the normalized peak volumes were used for quantification. No significant difference was found in expression levels, but both proteins were detected in the samples of the 2D-DIGE experiment. All animals were included in the WB analysis; control (C), onset (O), top (T) and recovery (R).

