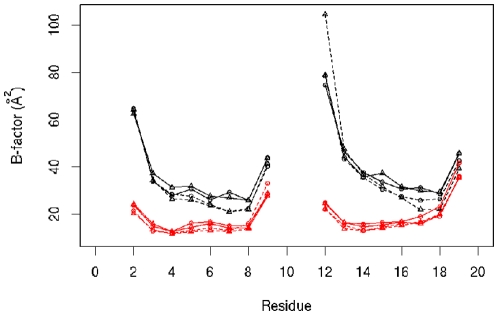
Figure 2. Theoretical B-factors for the four systems studied calculated from the simulations.
Black lines, B-DNA simulations; red lines, Z-DNA simulations; solid lines, unmethylated DNA; dahsed lines, methylated DNA; circles and tirangles, independent simulation results for each system. Terminal bases not included in the calculatieon. Bases 11 to 20 form the complementary strand.

