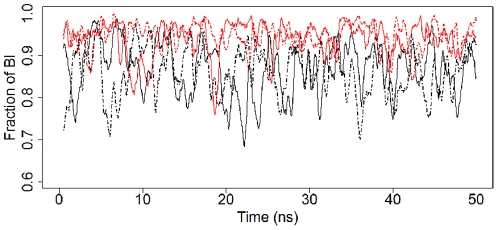
Figure 3. Time evolution of the fraction of BI states for B-DNA and 5mCB-DNA.
The fraction of nucleotides in BI (ε/ζ) conformation are shown as a function of time; black, unmethylated B-DNA; red, methylated 5mCB-DNA; solid and dashed lines, two independent 50 ns simulations. The plots are smoothed using a 500 ps sliding window.

