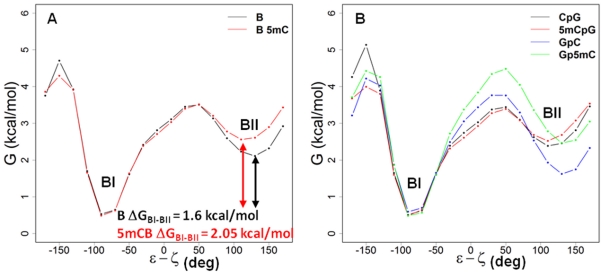
Figure 4. Relative free energy profiles across the ε−ζ reaction coordinates in B- and 5mCB-DNA.
The plots show the changes in free energy (y-axis) across the ε−ζ coordinate range (x-axis) that define the BI and BII sub-states. (A) Overall relative free energy profiles for unmethylated B-DNA (black) and methylated 5mCB-DNA (red). (B) Relative free energy profiles for unmethylated and methylated CpG and GpC steps. Black, CpG steps of B-DNA; red, 5mCpG steps of 5mCB-DNA; blue, GpC steps of B-DNA; green, Gp5mC steps of 5mCB-DNA.

