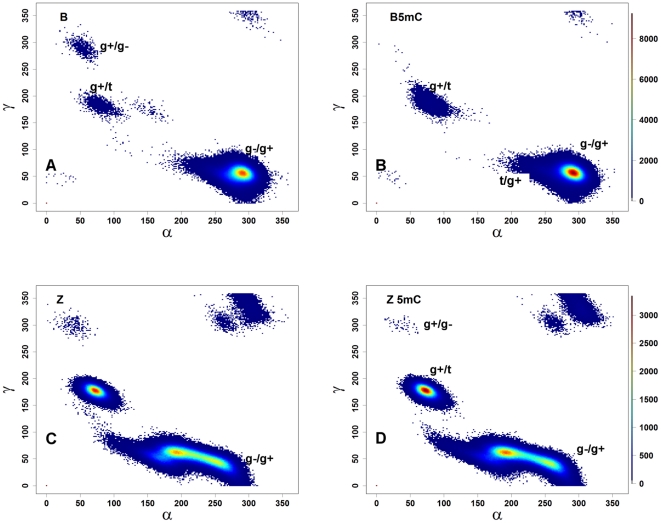
Figure 5. The α/γ distributions in B- and Z-DNA.
Landscape of the combined distributions of phosphate torsion angles along the α/γ space. (A) B-DNA; (B) 5mCB-DNA; (C) Z-DNA; (D) 5mCZ-DNA. The plots are color-coded based on the density of points. The results from the two independent simulations for each state are combined, giving 1.6 million points. The color bars on panels B and D show the density values for B- (panels A and B) and Z-DNA (panels C and D) simulations.

