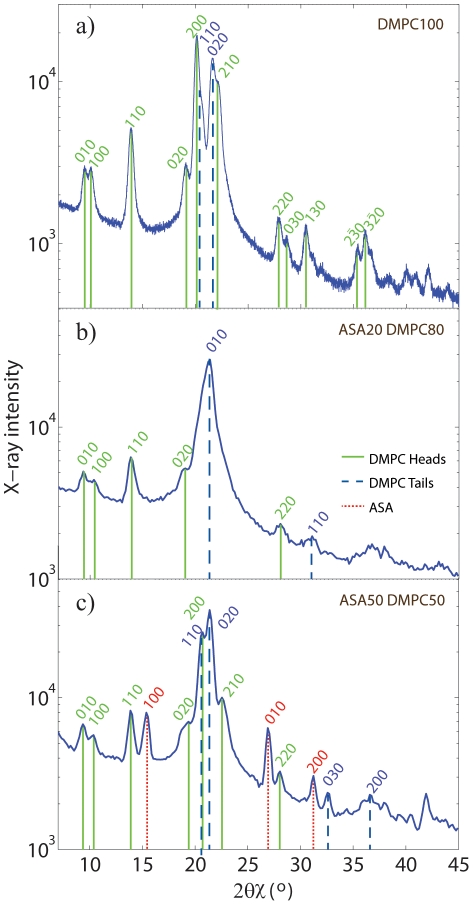
Figure 3. In-plane scattering integrations and fits.
In-plane scattering of the Samples 1, 6 and 10. Slices 0.03 Å 0.3 Å
0.3 Å were integrated to increase the statistics and enhance the data quality. Bragg peaks assigned to lipid head groups are plotted in green, lipid tails in blue, and ASA in red. a) 100% DMPC: data are described by an orthorhombic unit cell for the head groups and a monoclinic tail unit cell. b) The 20mol% ASA sample shows an ordered head group lattice, and a disordered, hexagonal tail lattice. c) Ordered structures for head groups (orthorhombic), tails (monoclinic) and ASA molecules (orthorhombic) are found for 50mol% ASA.

