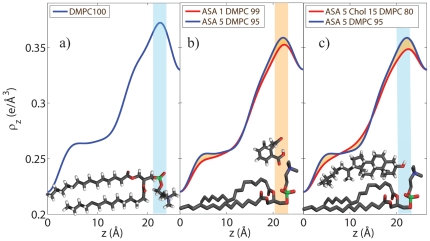
Figure 5. Normalized electron density profiles.
a) Electron density profile of Sample 1 (100% DMPC) . b) The position of the ASA molecule can be determined from the electron densities of Sample 2 (1mol% ASA) and Sample 3 (5mol% ASA). The ASA molecule can be placed in the head group region of the bilayer, at  values of 16 Å
 21 Å, with the hydrophilic oxygen groups at a
  position of
  21 Å, pointing towards the hydration water. c) By comparing electron densities of Sample 3 and Sample 11 the position of the cholesterol molecule can be determined. Cholesterol and ASA molecules co-exist in saturated lipid bilayers and cholesterol most likely takes an upright position with the hydrophilic head pointing towards the aqueous environment. DMPC, ASA and cholesterol molecules are drawn to visualize the most likely positions and orientations.

