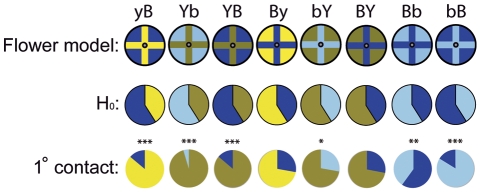
Figure 2. Area of first contact by flower-naïve moths.
In the upper row are the different flower models; in the middle row are the expected distributions, for each model. These are colour-coded under the null hypothesis of no bias. In the lower row are the actual distributions based on the recorded data. *p<0.05; **p<0.01; ***p<0.00001. α-level = 0.0063 after Bonferroni correction.

