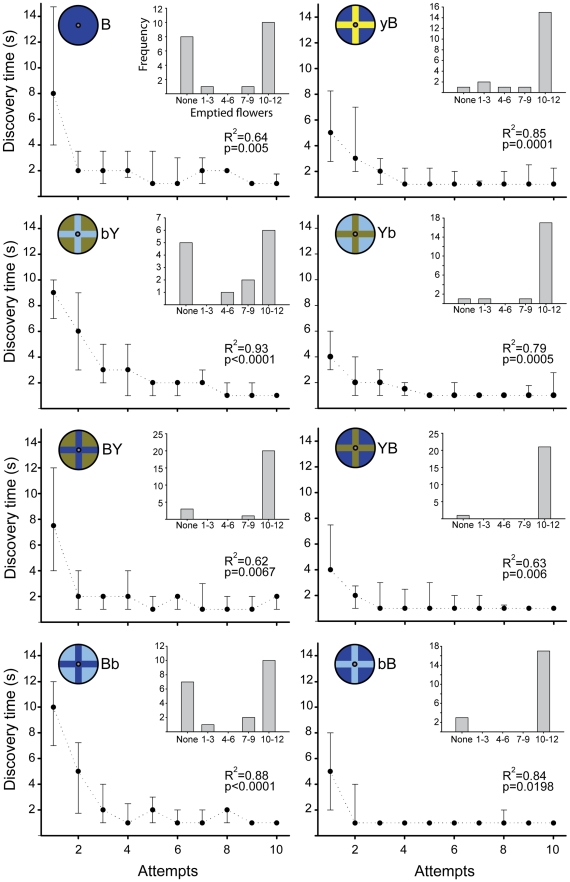
Figure 3. Discovery times (time elapsed (s) inspecting flowers, disregarding drinking and flying between models) vs. Attempts (1st, 2nd, …, 10th successful nectary discovery events).
R2 and p values are from tests for goodness of fit to an exponential decline function of 2 parameters (f(x) = a(−bx)), a typical learning curve. Insets: absolute frequency distributions of the number of successfully emptied flowers arranged in 5 bins (none, 1–3, 4–6, 7–9, and 10–12).

