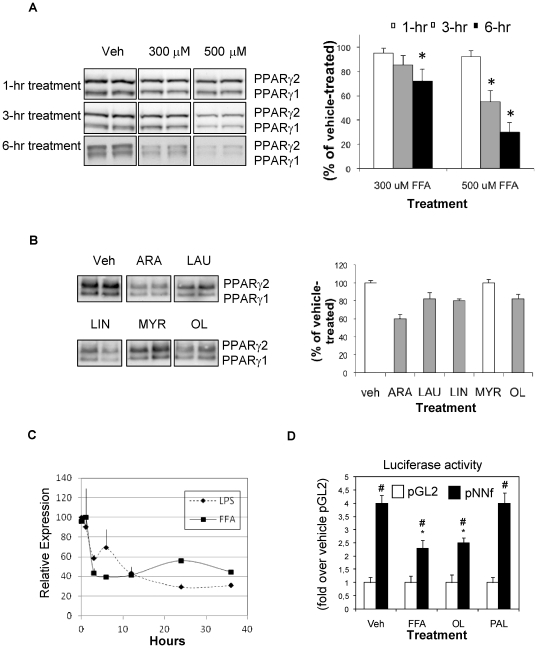
Figure 2. Free Fatty Acid treatment decreases adipocyte PPARγ expression.
Differentiated 3T3-L1 adipocytes were treated with 300 µM and 500 µM of a mixture of saturated and unsaturated FFAs for 1–6 hours (A), or with 500 µM of individual FFAs for 3 hours (B) (ARA, arachidonic acid; LAU, lauric acid; LIN, linoleic, acid; MYR, myristic acid; OL, oleic acid). Cell lysates were then analyzed for PPARγ protein content by SDS-PAGE fractionation and immunoblotting using a monoclonal antibody that detects PPARγ1 and PPARγ2 isoforms. Densitometric analysis of PPARγ protein collected from multiple experiments is presented in the right panels (A and B) *P<0.05. C) IPMacs were treated for the indicated times with LPS (5 ng/ml) or FFAs mixture (500 µM) and PPARγ expression was quantified by QPCR. D) 3T3-L1 adipocytes were electroporated with plasmids encompassing parts of the mouse (m)PPARγ2 promoter (PNNf) or no promoter (pGL2) fused to the firefly luciferase gene, along with the beta-galactosidase plasmid. Cells were treated with the FA mixture or with OL and PAL, the two major FAs found in plasma and then lyzed. Luciferase and beta-galactosidase (for normalization) activities were assayed. # P<0.05 for pNNf vs pGL2; * P<0.05 for pNNf of veh-control vs FA treatment.

