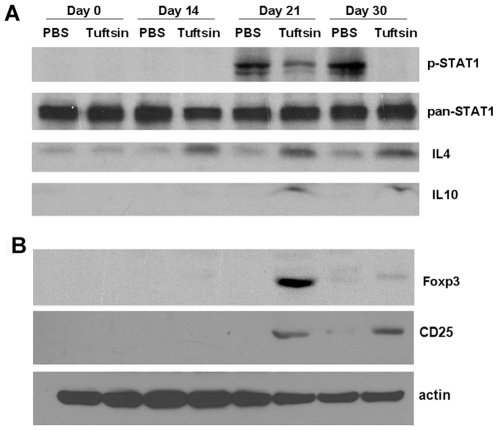
Figure 3. Tuftsin infusion induces the expression of Th2 and Treg cell markers.
Western blot analyses were performed on mouse spinal cord extracts at different timepoints following EAE induction to examine protein expression in the presence or absence of 500 µM tuftsin infusion. (A) Phosphorylation of STAT1 and the levels of the anti-inflammatory cytokines IL10 and IL4 were assessed in extracts from tuftsin-infused wt mice subjected to EAE. Equal loading of protein was confirmed by pan-STAT1 blotting. (B) Levels of the Treg transcription factor FoxP3 and the Treg cell surface marker CD25. Equal loading of protein was confirmed by actin blotting. (Western blots were repeated three times on mouse spinal cord samples from three separate EAE experiments, n = 3).

