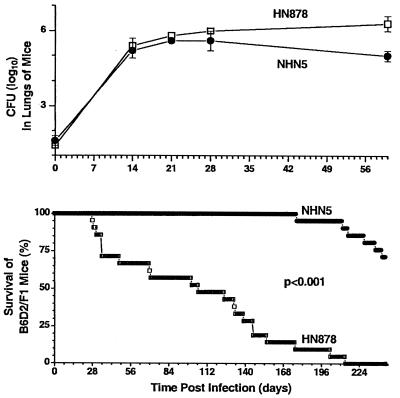
Figure 1.
Survival and bacterial load in lungs of B6D2/F1 mice infected with M. tuberculosis clinical isolates. Mice were infected by aerosol with 1.6 log10 NHN5 (●) or with 1.4 log10 HN878 (□). (Upper) Growth of mycobacteria in lungs. Results are from one representative experiment. Each time point is the mean of 3–4 mice per group per time point; error bars indicate SD. (Lower) Survival of infected mice. Results are from one representative experiment with 22 mice per group.

