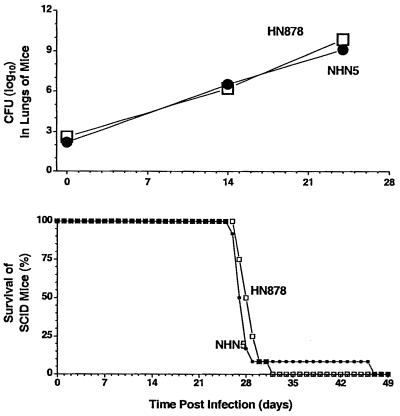
Figure 2.
Survival and bacterial load in lungs of SCID mice infected with M. tuberculosis clinical isolates. Mice were infected by aerosol with 2.2 log10 NHN5 (●) or with 2.6 log10 HN878 (□). (Upper) Growth of mycobacteria in lungs. Results are from one representative experiment. Each time point is the mean of 4–5 mice per group per time point. (Lower) Survival of infected mice. Results are from one representative experiment with 10 mice per group.

