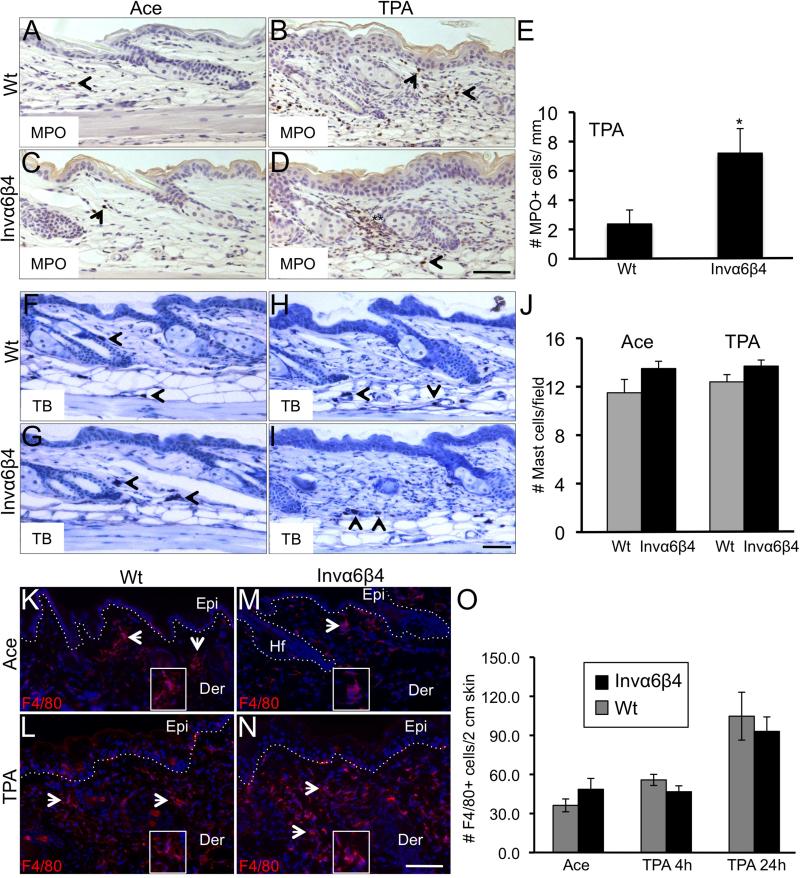
Fig. 2.
Analysis of MPO+, mast cell and macrophage skin infiltrates in response to TPA. (A-D) Immunodetection (arrowheads) of MPO+ infiltrating inflammatory cells in histological sections of acetone- (left panels) or TPA-treated (right panels) Wt (top row) or Invα6β4 (bottom row) mouse skin. Scale bar: 20 μm. (E) Bar graph depicting the average number of MPO+ dermal cells per mm of skin in TPA-treated Wt versus Invα6β4 mice, 3 mice per group. *- p = 0.036 (Student's t test). (F-I) Toluidine blue stain detection of infiltrating mast cells (arrowheads) in histological sections of acetone- (left panels) or TPA-treated (right panels) Wt (top row) or Invα6β4 (bottom row) mouse skin. Scale bar: 20 μm. (J) Bar graph depicting the average number of dermal mast cells per mm of skin in TPA-treated Wt versus Invα6β4 mice, 3 mice per group. (K-N) Immunodetection (arrowheads) of F4/80+ dermal macrophages in histological sections of acetone- (top row) or TPA-treated (bottom row) Wt (left panels) or Invα6β4 (right panels) mouse skin. Scale bar: 20 μm. Hashed lines demarcate the epidermal-dermal junction and boxes contain 4X magnification insets of F4/80+ dermal cells. Abbreviations: Epi, epidermis; Der, dermis; Hf, hair follicle. (O) Bar graph depicting the average number of F4/80+ macrophages per 2 cm of skin in TPA-treated Wt versus Invα6β4 mice, 3 mice per group.

