Figure 5.
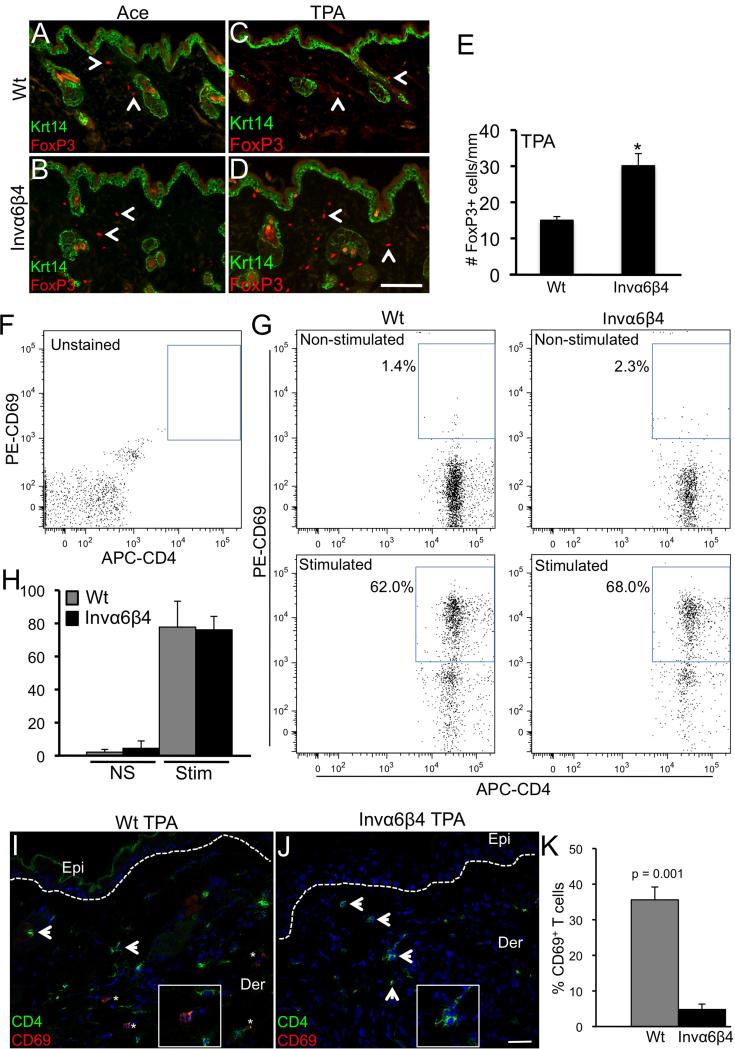
TPA-induced Foxp3+ cell infiltration and CD4+ T lymphocyte suppression in Invα6β4 skin. (A-D) Immunodetection of FoxP3 and Krt14 in histological sections from acetone vehicle- (left panels) or TPA-treated (right panels) Wt (top row) and Invα6β4 (bottom row) mouse skin. Arrow heads point to FoxP3+ dermal infiltrative cells. Scale bar: 50 μm. (E) Bar graph depicting the average number of FoxP3+ cells per mm of skin from 3 mice per group. *- p = 0.001 (Student's t test). (F and G) FACS dot plots showing a typical array of CD4+ (x-axis) versus CD69+ (y-axis) T lymphocytes detected in either non-stimulated or CD3/CD28-stimulated peripheral blood samples isolated from Wt or Invα6β4 mice. Blue box depicts the gate for CD4+CD69+ activated T lymphocytes for each plot. (H) Bar graph depicting the average number of CD4+CD69+ T lymphocytes from non-stimulated (NS) or CD3/CD28-stimulated (Stim) peripheral blood samples isolated from Wt or Invα6β4 mice, n = 3 mice per group and error bars represent standard deviation. (I and J) Immunodetection of CD4 (green) and CD69 (red) T lymphocytes in histological sections from TPA-treated (24 hr) Wt (left panel) and Invα6β4 (right panel) mouse skin. Arrowheads point to CD4+ infiltrative T cells and asterisks (*) designate CD4+CD69+ cells. Hashed lines demarcate the epidermal-dermal junction and boxes contain 4X magnification insets of immunopositive dermal cells. Abbreviations: Epi, epidermis; Der, dermis. Scale bar: 50 μm. (K) Bar graph depicting the percentage of CD4+ T lymphocytes co-expressing the activation marker CD69 in Wt versus Invα6β4 skin 24 hr following TPA treatment, n = 3 mice per group and error bars represent standard deviation.

