Figure 1.
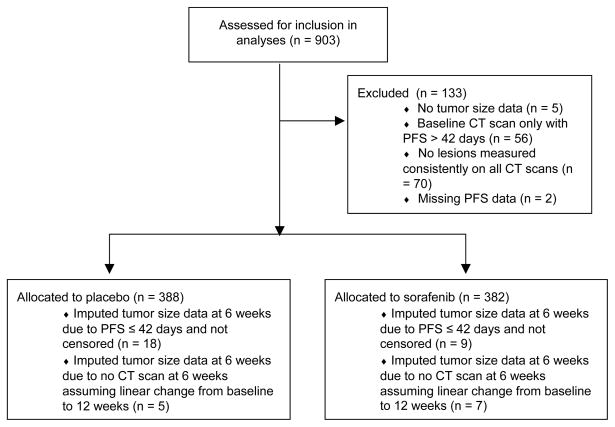
Figure 1a. Flow diagram for TARGET data, indicating the reasons for exclusion from the analyses and the numbers of patients with imputed data.
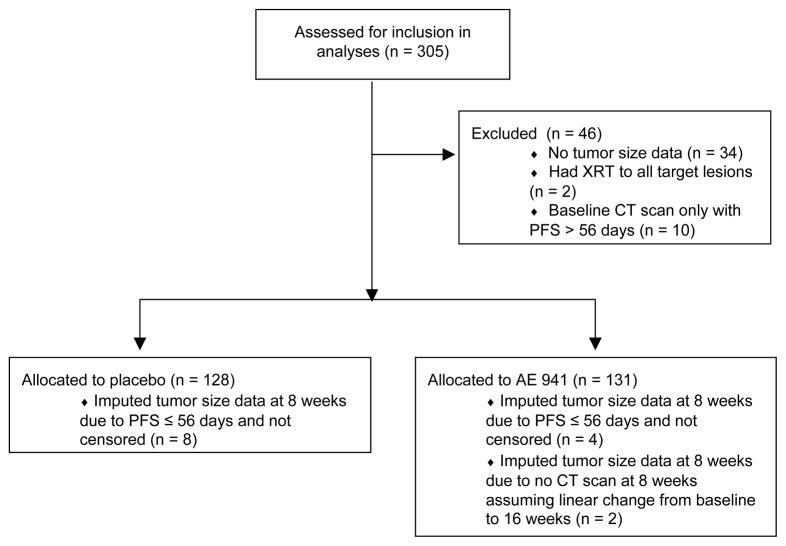
Figure 1b. Flow diagram for AE 941 trial data, indicating the reasons for exclusion from the analyses and thenumbers of patients with imputed data.


