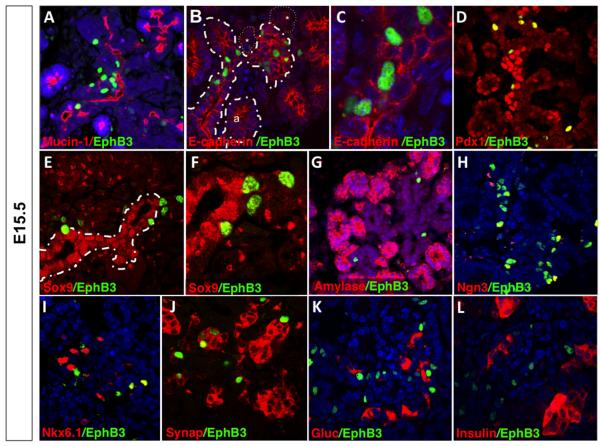
Figure 4. Pulse-chase lineage tracing: Second transition induction and assay after 1 day (at E15.5).
Immunostaining of anti-β-gal (green) and pancreatic markers (red) show that EphB3 is expressed in delaminating pro-endocrine cells. Sagittal sections of E15.5 EphB3rtTA-lacZ pancreata. EphB3+ cells (green) and (A) Mucin+, (B,C) E-cadherin+; (D) Pdx1+; (E,F) Sox9+; (G) amylase+; (H) Ngn3+; (I) synaptophysin+ (Synap); (J) Nkx6.1+; (K) glucagon+ (Gluc); or (L) insulin+ (Ins) cells (red). Pancreatic epithelium is outlined by stippled lines; endocrine clusters in B, *.

