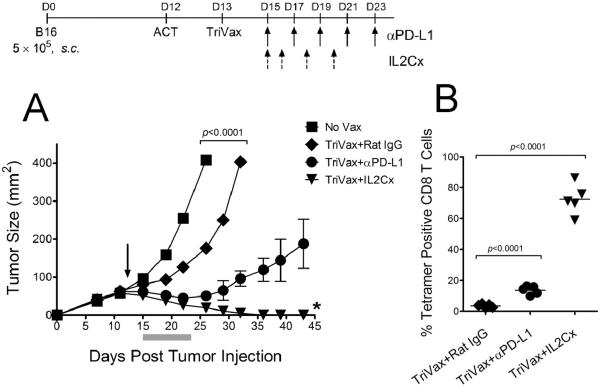
Figure 3. Therapeutic effects of ACT/TriVax against advanced B16 tumors.
(A) B6 s.c. mice (5/group) were injected with 5 × 10⁵ B16 cells, and on day 12 received 1 × 10⁶ Pmel-1 cells followed by TriVax on day 13 (arrow) and PD1 blockade or IL2Cx. P values were calculated using two-way ANOVA. * = 4/5 mice rejected their tumors. (B) Antigen-specific CD8 T cells evaluated by tetramer analysis on day 25 using blood samples. Points, value for each mouse; horizontal lines, averages of the group. P values were calculated with unpaired Student's t tests.

