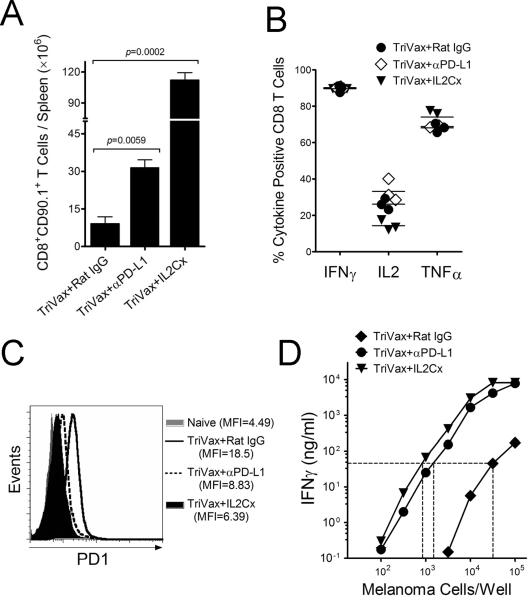
Figure 4. IL2Cx and PD1 blockade improve quantitatively and qualitatively T cell responses after ACT/TriVax.
Tumor-free B6 mice (4/group) received 3 × 10⁵ Pmel-1 cells followed by TriVax with or w/o anti-PD-L1 mAb or IL2Cx, administered as described in Figure 2A. (A) On day 14 after TriVax the total number of Pmel-1 cells (CD90.1) were enumerated in the spleens. P values were calculated with unpaired Student's t tests. (B) Antigen-induced production of cytokines evaluated by intracellular staining after stimulation with hgp10025 peptide. Points, values for each mouse; horizontal lines, averages of each group. (C) The expression of PD-1 on Pmel-1 CD8 T cells evaluated by flow cytometry. MFI, median fluorescence intensity. (D) Antigen-induced IFNγ production of purified CD8 T cells evaluated by ELISA after stimulation with various numbers of B16 cells. The same number of CD8/CD90.1 cells from all treatment groups were placed in each culture. Dotted lines are for comparison on the efficacy of the various T cells to recognize the tumor cells (i.e., amount of antigen required to obtain the same amount of IFNγ).

