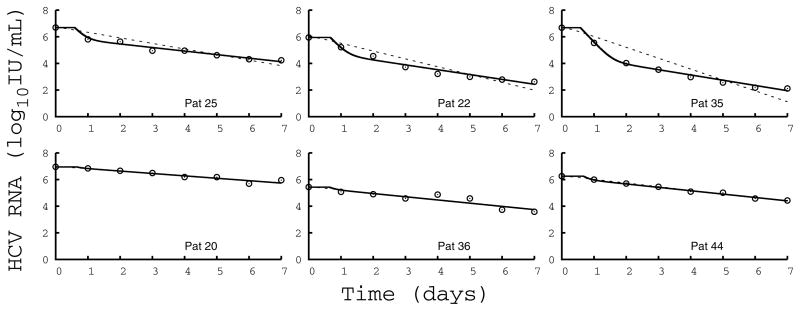
Figure 1.
Fit of the model (Eq.1) to HCV RNA kinetics. Comparison of measured HCV RNA (circle) and best-fit prediction assuming SIL blocks viral production and viral infection (solid line) or blocks only infection (dotted line) in 6 representative patients dosed at (left) 10mg/kg/day, (center) 15mg/kg/day, and (right) 20 mg/kg/day. For each dosing group, one patient with a biphasic (upper row) and one with a monophasic (lower row) decline are shown. Parameter values used to generate the fits are given in Table S1.

