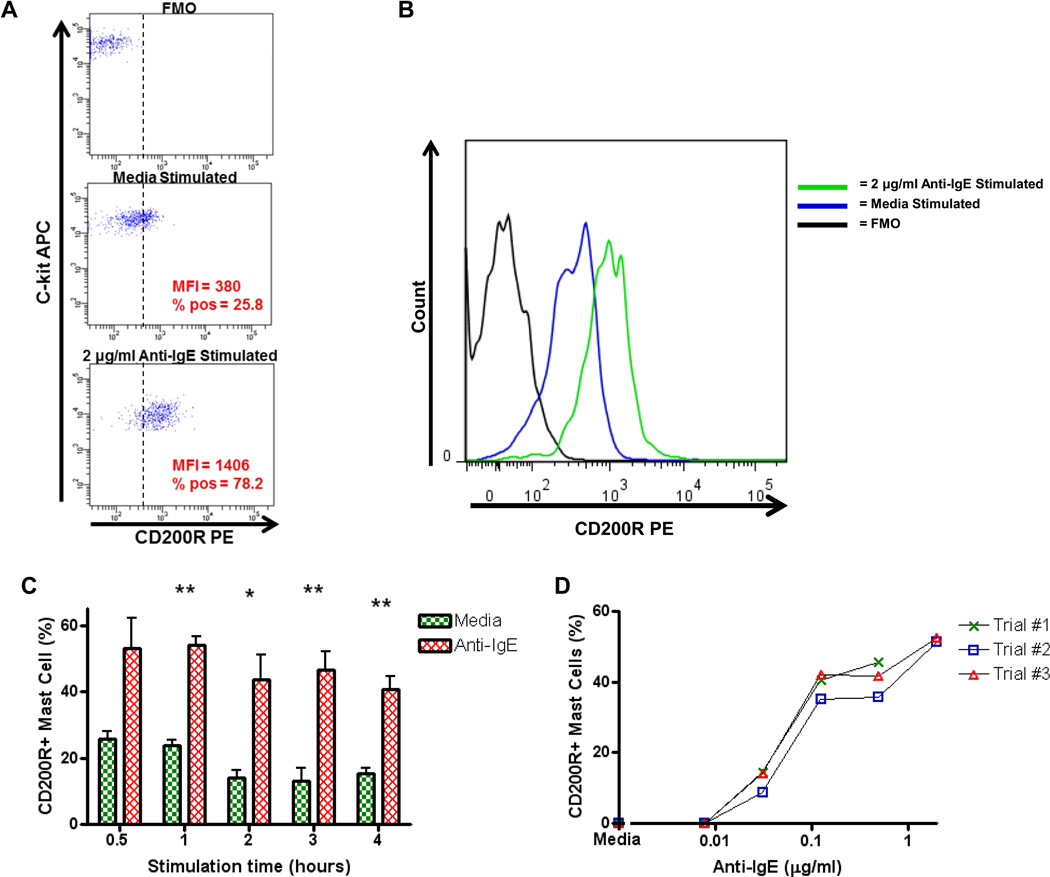
Figure 4.
Mast cell surface CD200R1 expression following activation with anti-IgE. A. Dot plot graphs of CD200R1 expression on peritoneal mast cells. Peritoneal cells were incubated for 3 h with media alone or 2 µg/ml of anti-IgE and then analyzed by flow cytometry. Mast cells were gated as IgE+ c-kit+ (as per figure 1B) and then evaluated for surface CD200R1 expression. Top panel shows PE staining in the absence of anti-CD200R1-PE staining (FMO, fluorescence minus one). The FMO panel was used to set a cut-off for CD200R1 positivity (dashed vertical line). MFI values are for the entire population of mast cells. % pos = % of all mast cells positive for CD200R1. B. Activation of identical mast cells shown in panel A displayed as a histogram. C. Percentages of mast cells expressing CD200R1 after stimulation of peritoneal cells with media and 0.125 µg/ml anti-IgE for 0.5, 1, 2, 3, and 4 hours (n = 3 per condition). Means +/− SEMs are shown. D. Percentages of mast cells expressing CD200R1 in response to stimulation with 0.0078, 0.031, 0.125, 0.5, and 2.0 µg/ml anti-IgE for 3 hours and after subtracting media stimulation levels. * = p < 0.05, ** = p < 0.01.

