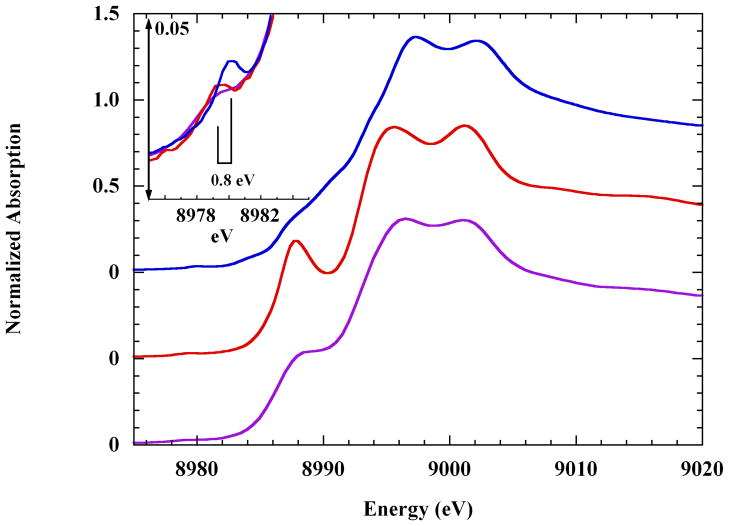
Figure 2.
Cu K-edge XAS spectra of copper(II)-tetra-imidazole, as: (top), the solution complex; (middle), the crystalline sulfate complex, and; (bottom), the crystalline dinitrate complex (see the Materials and Methods section). The latter two spectra have been offset by −0.50 and −1.0 normalized absorption units, respectively. Inset: the pre-edge energy region showing the 1s→3d transition of: (
 ), the solution spectrum; (
 ), the solid sulfate, and; (
 ) the solid dinitrate. The space-bar shows the ~0.8 eV difference in the transition energies.

