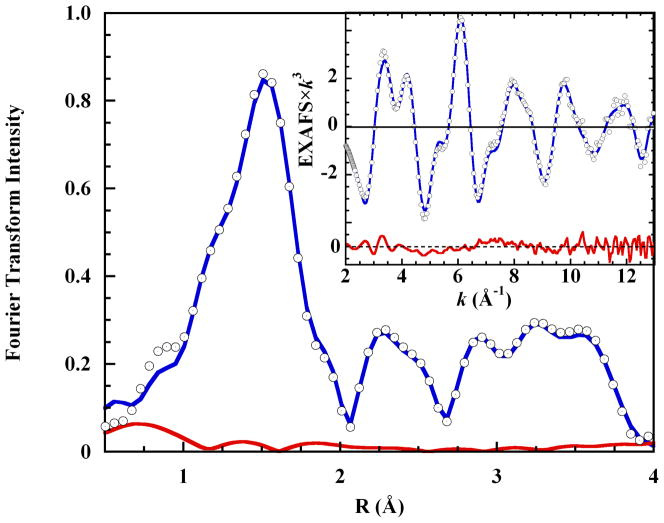
Figure 5.
(○), Fourier transform of the K-edge EXAFS spectrum of 0.10 M Cu(II) in aqueous 4 M imidazole solution; (
 ), the final fit using the split axial model with eight outlying oxygen scatterers distributed into two shells (see Table 1 for the metrics), and; (
 ), the fit residual. Inset: (○), the EXAFS spectrum; (
 ), the final fit, and; bottom, (
 ), the fit residual

