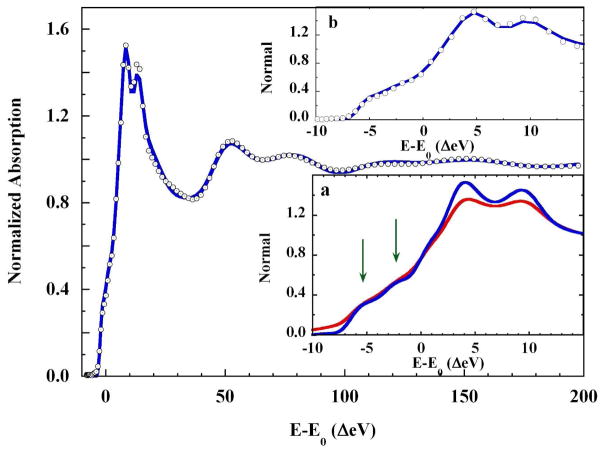
Figure 7.
(○), Core-hole deconvolved K-edge XAS spectrum of 0.10 M Cu(II) in 4 M imidazole liquid aqueous solution and; (
 ), the fit to the spectrum (Rsq = 1.69). Inset a: The rising edge region of: (
 ), the K-edge spectrum of 0.1 M Cu(II) in 4 M imidazole liquid aqueous solution, and; (
 ), the same spectrum with core-hole broadening removed. Arrows show the emergent delineation of the rising edge features when broadening is removed. The resolution of the K-edge maximum is also enhanced. Inset b: (○), the rising K-edge XAS spectrum deconvolved from core-hole broadening, and; (
 ), the fit to the deconvolved XAS spectrum. The rising K-edge features are fully reproduced by this fit.

