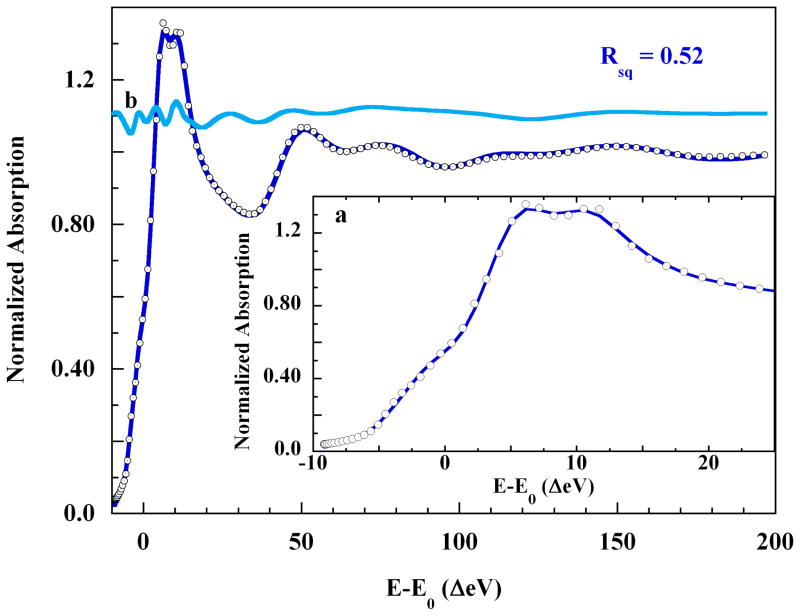
Figure 9.
(○), the K-edge XAS of 0.10 M Cu(II) in 4 M aqueous imidazole, and; (
 ), the MXAN fit using the split-axial pyramidal model and including eight distant solvent waters at 4.2±0.3 Å. Insets: a. Expansion of: (○), the rising edge energy region, and; (
 ), the fit the rising edge. b. (
 ), the contribution to the XAS intensity made by the eight-water solvation shell, plotted on the same scale and shifted vertically by 1.1 normalized units.

