
Figure 2.
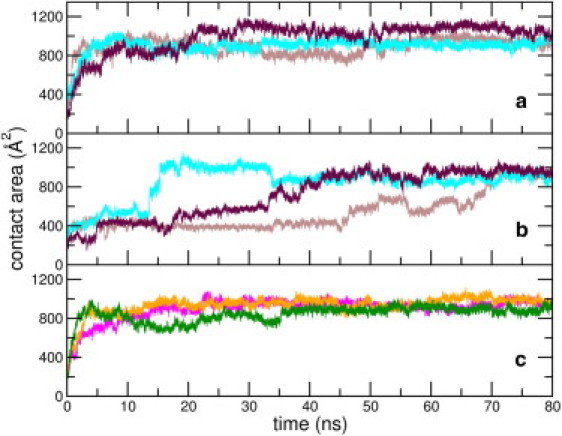
(Color online) Evolution of peptide-SWCNT contact area over (a) three NT1 trajectories, (b) three NT2 trajectories, and (c) NT3 (in green), NT4 (in magenta), and NT5 (in orange) trajectories. Snapshots of NT1 and NT2 shown in the Supporting Material correspond to the plotted data (in brown).