
Figure 3.
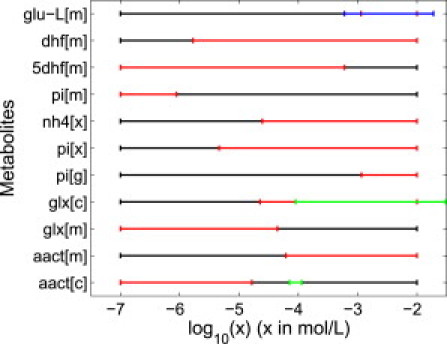
Default (black) and predicted variability (red) in logarithmic concentration ranges, where the predicted concentration range was narrower by an order of magnitude or more. As described in the Concentration Variability section, we predicted concentration variability by combining the thermodynamic data computed in this study with knowledge of reaction directions required for metabolically essential functions. We observed that predicted concentration agrees well with available literature on experimentally observed concentration ranges (blue) or Michaelis constants (green) of compartment-specific enzymes consuming the corresponding metabolite. Metabolite names corresponding to the abbreviations in the figure are given in the Supporting Material.