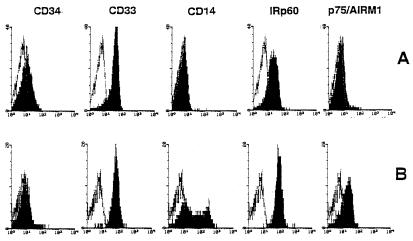
Figure 1.
Surface markers of two representative AML. AML cells were analyzed for the surface expression of the indicated molecules by indirect immunofluorescence and FACS analysis. Results are expressed as log green fluorescence intensity vs. arbitrary units. (A) GT1 belonging to the M1 FAB subtype. (B) 2412 belonging to the M5 FAB subtype.

