
Figure 1.
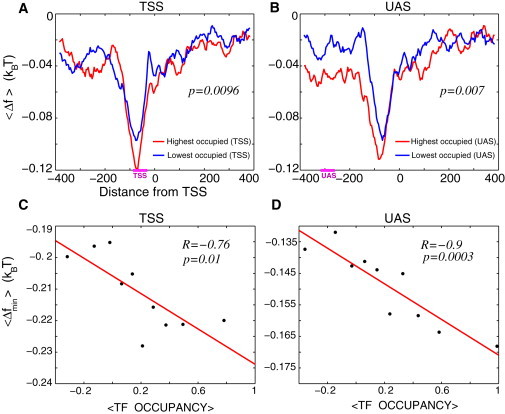
(A) Average free energy of nonspecific TF-DNA binding per bp, , computed within the interval (−384,384) for the two groups of genes selected according to the experimentally measured average TF occupancy in the TSS region: 10% highest TF occupancy in the TSS region (red) and 10% lowest TF occupancy in the TSS region (blue). Each group contains 496 genes. Horizontal bar, marked TSS, on the x axis, shows the corresponding region where the TF occupancy was measured. (B) Similar to (A), but the two groups of genes are selected according to the experimentally measured average TF occupancy in the UAS region. Horizontal bar, marked UAS, on the x axis, shows the corresponding region where the TF occupancy was measured. (C) Correlation between the minimal value of the free energy of nonspecific TF-DNA binding within the TSS regions, , and the average TF occupancy within this region. Genes were binned into 10 bins according to the value of the average TF occupancy. Each point in the graph corresponds to the average, , for the genes in a given bin plotted as a function of the experimentally measured average TF occupancy for the genes in this bin. (D) Analogous to (C), but for computed within the UAS regions, plotted versus the average TF occupancy measured within the UAS regions, as described in C.