
Figure 3.
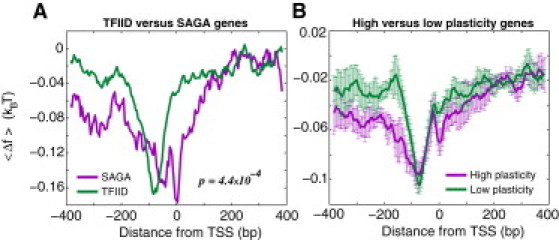
(A) Average free energy of nonspecific TF-DNA binding per bp, , computed within the interval (−384,384) for the highly confident SAGA-dominated and TFIID-dominated groups of genes, respectively. There are 40 SAGA-dominated, TATA-containing genes and 178 TFIID-dominated, TATA-less, nonribosomal protein genes, respectively (these highly confident groups are taken from (1)). (B) Average free energy of nonspecific TF-DNA binding per bp, , computed within the interval (−384,384) for the high and low transcriptional plasticity genes, respectively. There are 732 genes in each group. To compute error bars, we divided each group of genes into five arbitrary subgroups, computed in each of the subgroups, and computed the standard deviation of between the subgroups. Error bars correspond to one standard deviation.