
Figure 4.
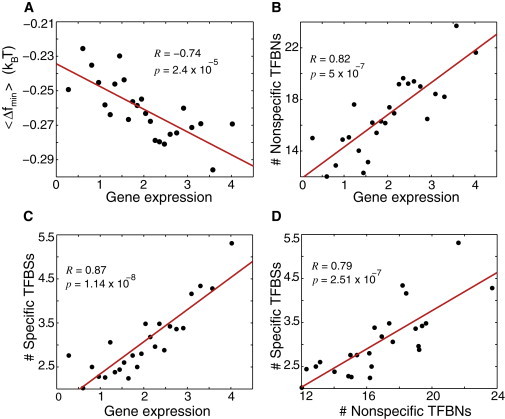
(A) Correlation between the minimal value of the free energy of nonspecific TF-DNA binding in the promoter region, within the interval (−150,0), , and the average value of gene expression within this region. All ∼5000 genes were binned into 25 bins according to the level of gene expression. Each point in the graph corresponds to the average, , for the genes in a given bin plotted as a function of the experimentally measured average level of gene expression for the genes in this bin. (B) Correlation between the computed number of nonspecific TFBNs within the interval (−150,0), and the level of gene expression. A given genomic coordinate is assigned to belong to nonspecific TFBN, if the average free energy of nonspecific TF-DNA binding per nucleotide is smaller than a given cutoff value, . (C) Correlation between the number of specific TFBSs and the gene expression. The information about specific TFBSs is taken from (33). (D) Correlation between the number of specific TFBSs and the number nonspecific TFBNs. The binning in B–D is preformed as in A.