
Figure 5.
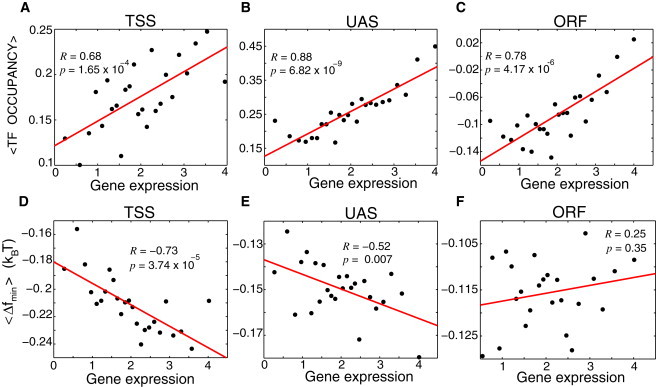
Analysis of experimental results from (1): Correlation between the average TF occupancy and the level of gene expression for TSS (A), UAS (B), and ORF (C) regions, respectively. Genes were binned into 25 bins according to the level of gene expression. Each point in the graph corresponds to the average, experimental TF occupancy for the genes in a given bin plotted as a function of the experimentally measured, average level of gene expression for the genes in this bin. Correlation between the computed, average value of the minimal free energy of nonspecific TF-DNA binding, , and the level of gene expression for TSS (D), UAS (E), and ORF (F) regions, respectively. The binning is performed as explained previously.