
Figure 5.
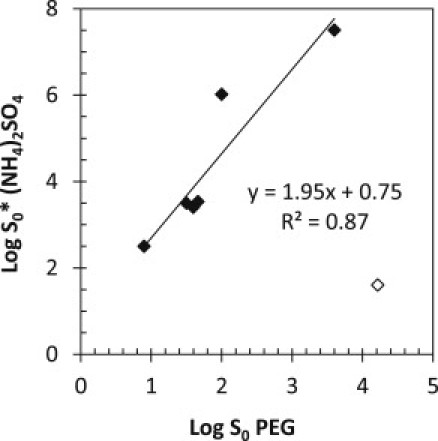
Comparison of the solubility data obtained in ammonium sulfate and PEG-8000. Log S0-values obtained from PEG-8000 precipitations are plotted against Log S0∗-values from ammonium sulfate precipitations for all of the proteins. The data correlate strongly, suggesting a relationship between solubility results obtained with PEG-8000 and ammonium sulfate. α-Lactalbumin is shown as an open diamond and is excluded from the fit.