
Figure 5.
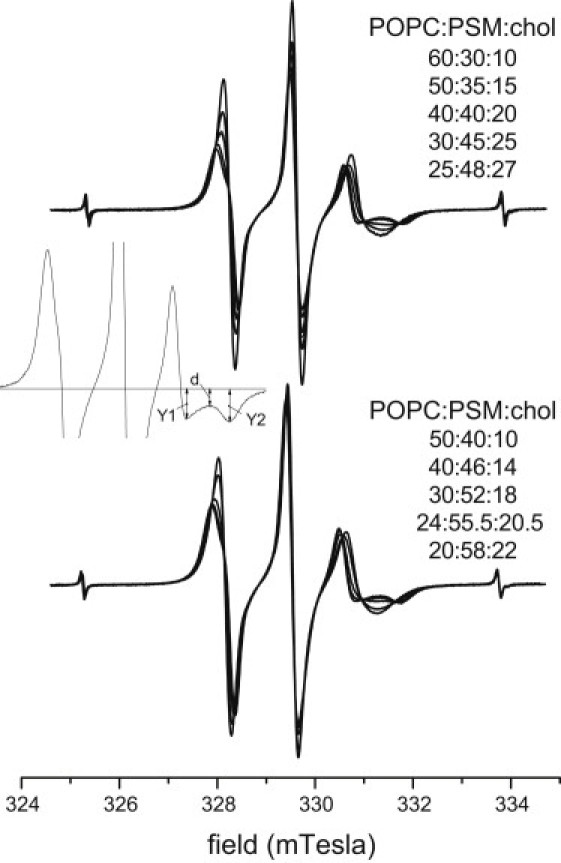
Isosbestic sets of first-derivative V1-EPR spectra from the 16-PCSL spin label in POPC/PSM/chol membranes corresponding to tie lines in the central (top panel) and low (bottom panel) parts of the Lα+Lo coexistence region. With decreasing line height, the spectra correspond to the following POPC/PSM/chol compositions: 60:30:10, 50:35:15, 40:40:20, 30:45:25, and 25:48:27 mol/mol/mol (top); and 50:40:10, 40:46:14, 30:52:18, 24:55.5:20.5, and 20:58:22 mol/mol/mol (bottom). Spectra are normalized to constant second integral. T = 23°C. The fine-line spectrum in the top panel is obtained by weighted addition of spectra for POPC/PSM/chol compositions 60:30:10 and 30:45:25 mol/mol/mol, in the ratio 1:0.47. It is almost indistinguishable from the spectrum for POPC/PSM/chol composition 40:40:20 mol/mol/mol. The inset defines the parameters used in the subtraction procedure to establish the endpoint spectra; see text for details.