
Figure 2.
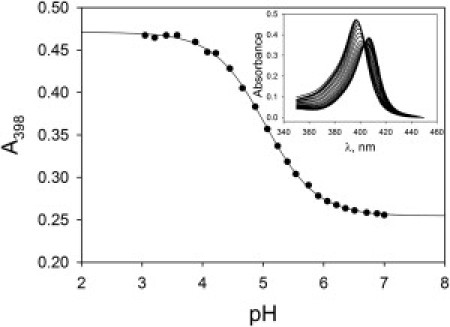
Plot of absorbance at 398 nm, A398, versus pH for the NH5G-4 variant in 3.0 M GdnHCl at 20 ± 2°C. (Solid line) Fit of the data to a modified version of the Henderson-Hasselbalch equation as described in the Materials and Methods. (Inset) Absorbance spectra from 350 nm to 450 nm for pH values from 7 to 3 in ∼0.2 pH increments. To the left of the isosbestic point at 404 nm, absorbance increases as pH decreases.