
Figure 3.
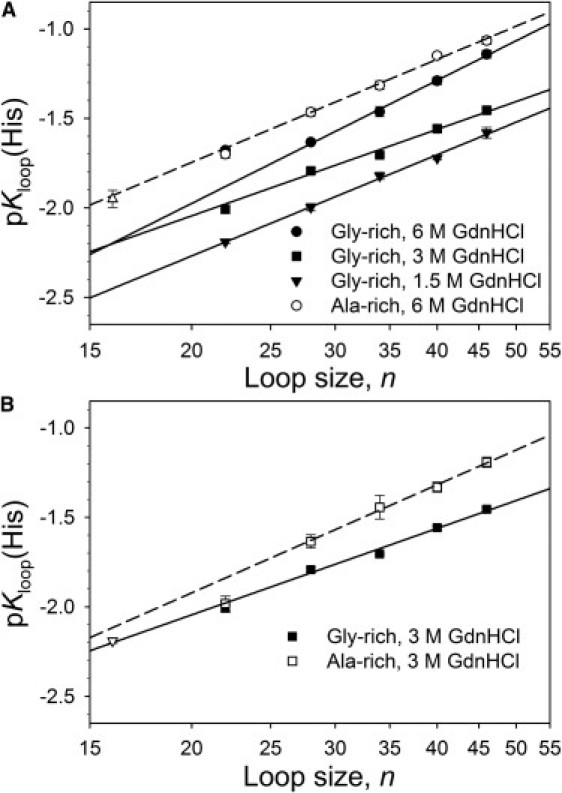
(A) Plots of pKloop(His) versus loop size, n (scale is logarithmic), for the Gly-rich variants at 1.5 M (▾), 3.0 M (■), and 6.0 M (●) GdnHCl and the Ala-rich variants at 6.0 M GndHCl (○). Data point for the variant with no insert (n = 16) at 6.0 M GdnHCl (Δ). (B) Comparison of pKloop(His) versus loop size, n (scale is logarithmic), for the Gly-rich (■) versus the Ala-rich (□) variants at 3.0 M GdnHCl. Data point for the variant with no insert (n = 16) at 3.0 M GdnHCl (∇). In both panels, the Gly-rich variants (solid lines) and Ala-rich variants (dashed lines) are fits of Eq. 3 to the data for n ≥ 28. The values of ν3 obtained from these fits are reported in Table 2. pKloop(His) was calculated using Eq. 2 and data from Table S2 in the Supporting Material using pKa(HisH+) = 6.6. Data for the Ala-rich and no-insert variants are taken from Tzul and Bowler (19).